


Comparing Belmont Stakes Racing Festival vs. Saratoga Track Profiles
Finding where to focus when handicapping and betting this week for the Belmont Stakes Racing Festival at Saratoga.

Are you ready to dial in contenders for Belmont Stakes week?
Going through last year’s Belmont Stakes Racing Festival results compared to the Saratoga meet, some track trends showed up in both profiles.
There are two things to be ready for:
Early speed on the dirt
Closers on the turf
Historically, following these two biases should put you ahead of the public for the racing at Saratoga. Charting race by race will be the best way to see any track bias forming this week. It happened last year on a day during Belmont Stakes week, when only stalkers and closers won sprinting on the dirt.
Dirt Sprints
As expected, early speed is the trend to be ready for this coming week. Last year during Belmont Stakes week, they were 9-for-16, winning 56% of races. During Saratoga, you see that forward runners performed exceptionally well.
Closers struggled as a whole. Both profiles were under 20% winners.

As far as post positioning, it is hard to get a read from the limited racing during Belmont Stakes week. The key will be seeing that posts 1-3 had the edge. They won 9 of 16 races during Belmont Stakes week. During the Saratoga meet, posts 1-3 won 40% of races.
Both meets face the factor of field size. You’re looking at around 7 to 8 runners per race. That is always important when determining how strong a post position bias is.

Looking at each distance, the 7-furlong races stand out. 6 of the 8 races were won by early horses. That is even further supported when looking at the average positioning and beaten lengths at each call of winners compared to the average field size. Winners came from one of the top three runners at the 1st call.
Watching daily if this same trend emerges will be important.
Dirt Mile
What’s clear is that the inside post draw is critical when handicapping these mile races. Posts 1-3 dominated during the Saratoga meet, winning 60% of races. During Belmont Stakes week, they shared 4 wins with posts 4-6.

Just like the dirt sprints, horses running on or near the pace performed best in 2024 at the mile distance. Closers struggled significantly, being under that 20% mark in both profiles.
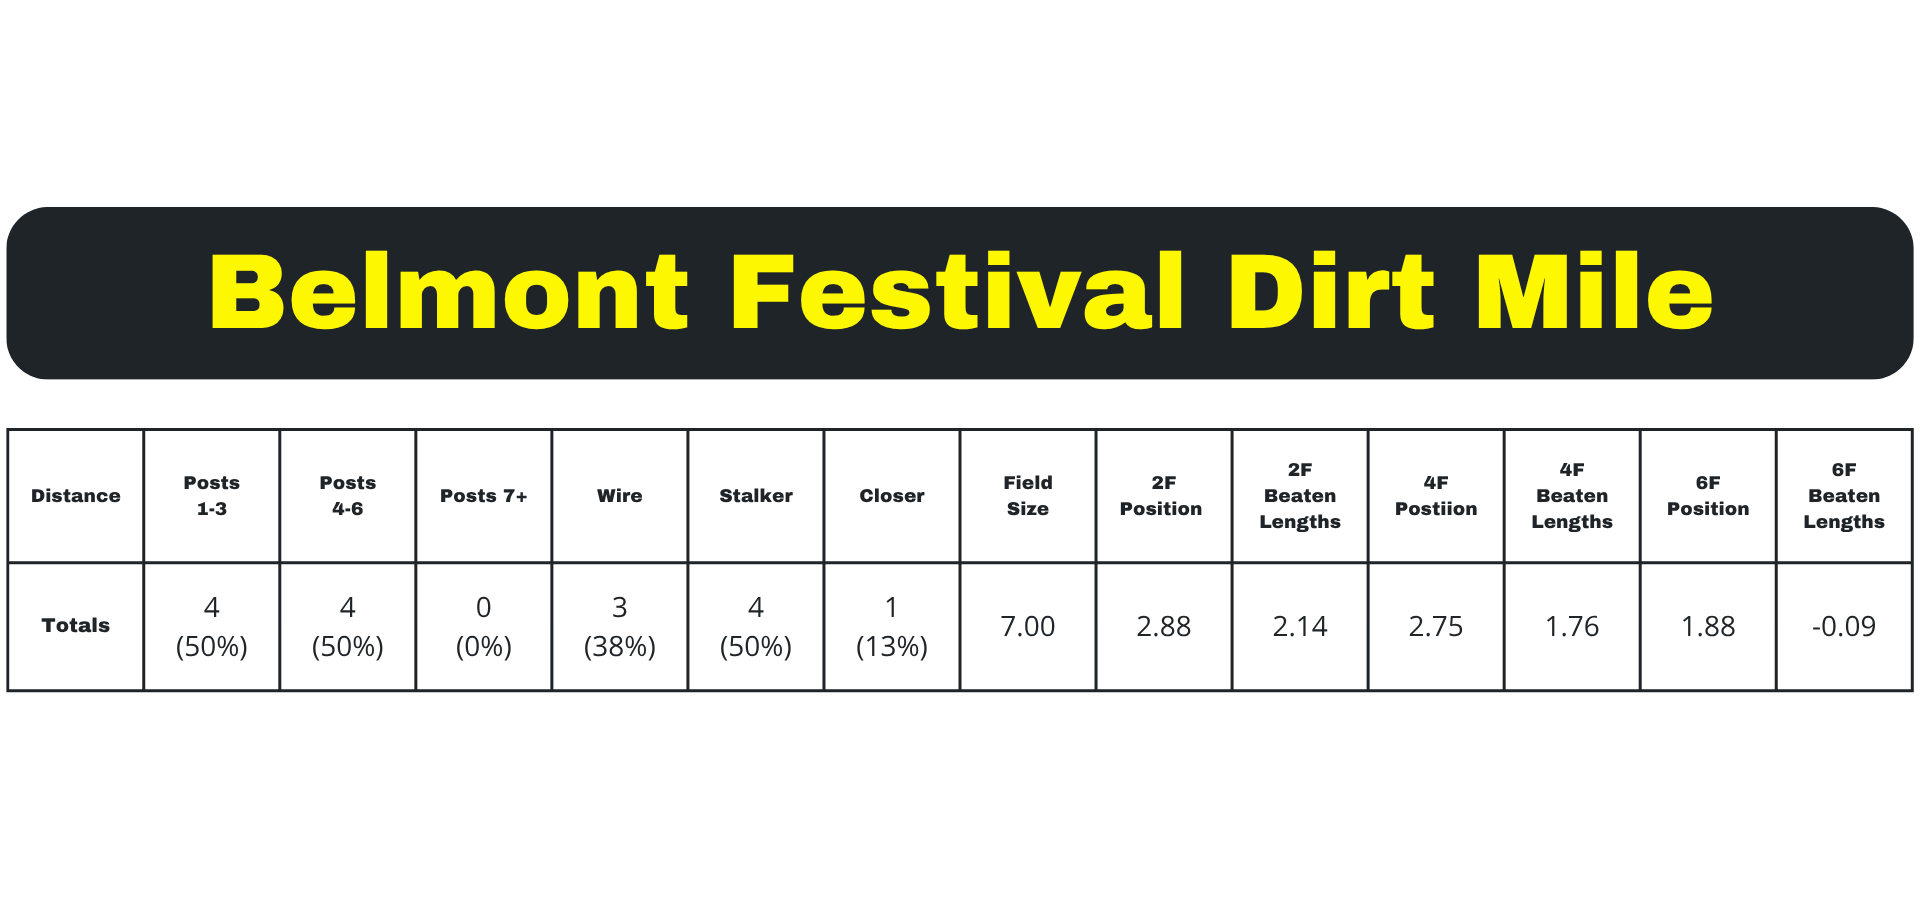
What’s interesting is looking at the average positioning and beaten lengths of winners at the 6-furlong call. Winners on average were in 1.88th place. Races by this point were essentially over. If you remember from the 2024 Saratoga meet, the same trend happened. For the Saratoga meet, winners on average were in 2.22 place and 0.38 lengths off the leader at the 6-furlong call.
Making up ground late in these races doesn’t happen often. Positioning against the projected fractions is important when handicapping.
Dirt Routes
Small sample sizes for each track profile, but two things are apparent. First, posts 1-3 were the place to be. They won 4 of 7 races during Belmont Stakes week. At Saratoga, that trend carried over. Second, horses who want to close should be evaluated closely.

Looking at the average beaten lengths of winners at each call gives a better visual of what winners look like. They were less than a length off the leader on average. When looking at the 1-mile and 1/8 races, they were even more forward. That is further proof of how good speed is over this dirt.

Turf Sprints
Just five turf sprints last year during Belmont Stakes week, but there was a trend that followed the Saratoga meet. Early runners had the edge. They ended up winning 43% of races at the Saratoga meet.

Post position wise, there isn’t a whole lot to go on for either of the track profiles.

What catches the attention is the positioning of winners at each call. When considering there were 10.40 runners per race, winners came from horses close to the pace. This was the same trend for the Saratoga meet. During the summer, winners on average were in 3.81 place at the 1st call.
Turf Routes
Just three races last year for Belmont Stakes week. It showed what you saw for the Saratoga meet: off-the-pace runners controlled the races.

What could be something to watch for are posts 4-6. During the Saratoga meet, they struggled. For what it’s worth, they did go 0-for-3 Belmont Stakes week.

When looking at the average beaten lengths of winners, it is clear that coming off the pace was best. With the average field size of 10.50 runners per race, there is a good chance that there was more than one early runner. That sets up the stalkers and closers in these races.
Inner Turf Routes
The similarity in winning running styles is clear here. Closers dominated on the inner turf in both track profiles. Come the Saratoga meet, they were winning almost every other race with that 49% clip.

Seeing posts 1-3 go 0-for-7 during the Belmont week is something, in my opinion, that is a non-factor. Looking at the Saratoga meet, they had the most amount of wins. Watch it early in the days of racing this week if they struggle.
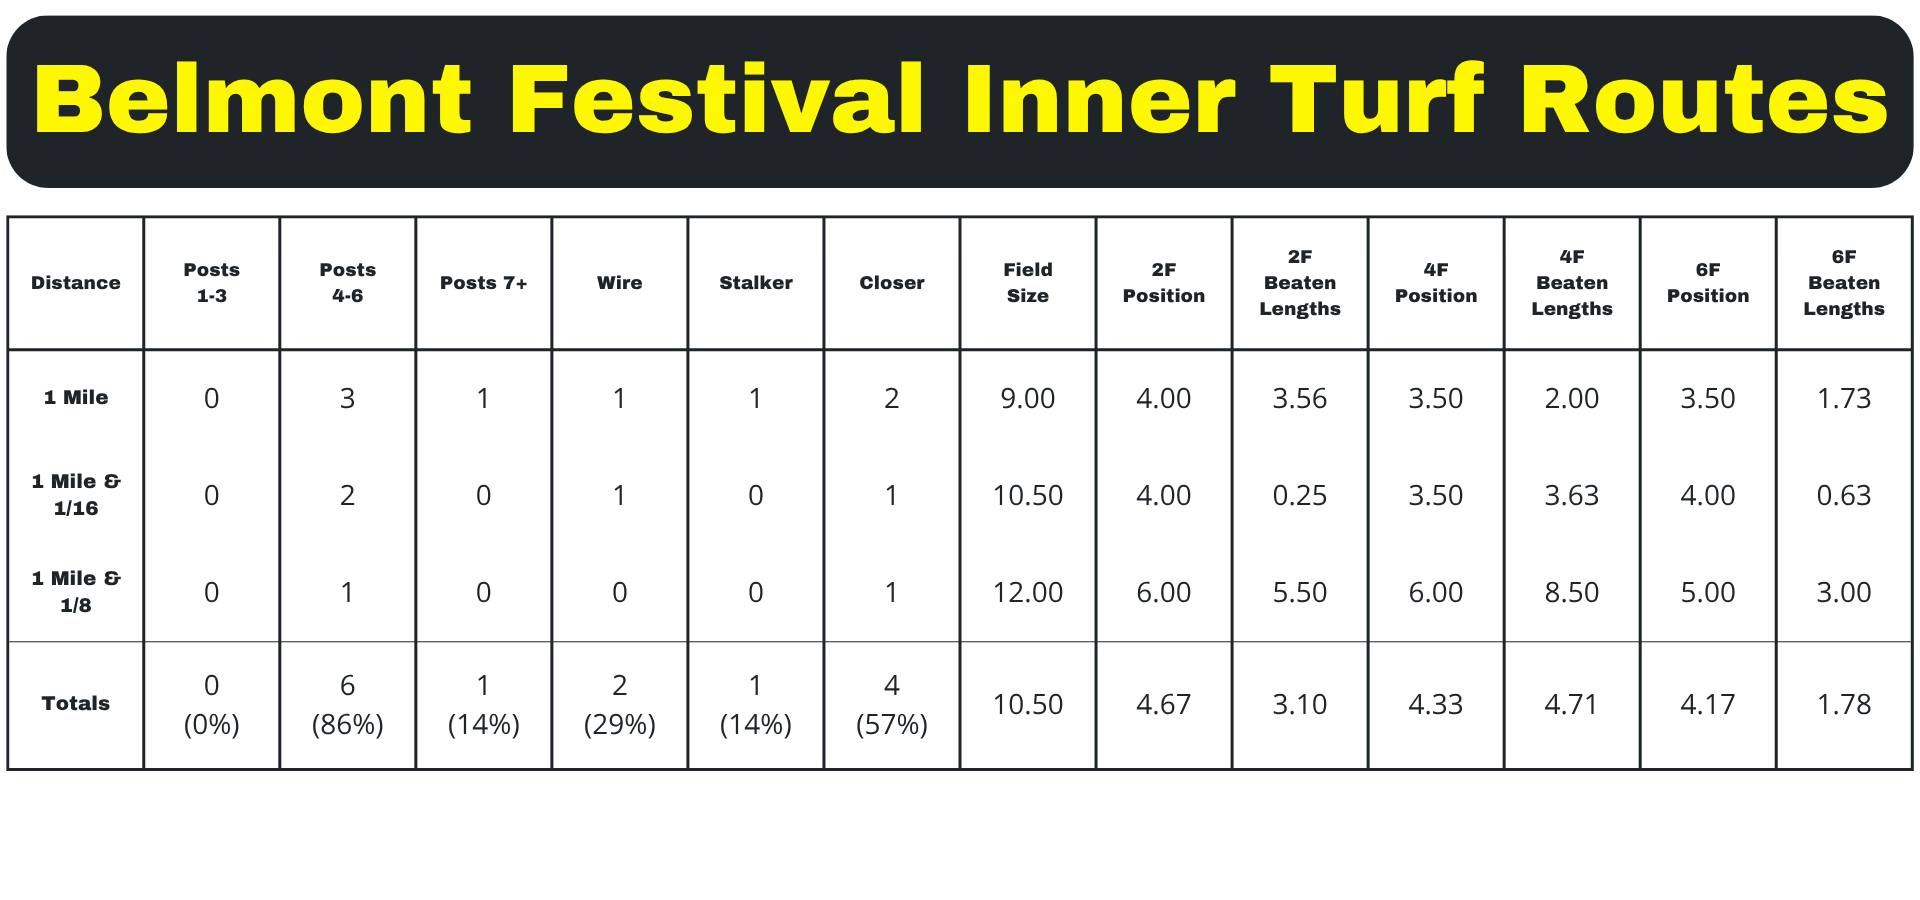
Seeing the breakdown further supports the off-the-pace running when looking at the average beaten lengths of winners. That goes for the positioning. Winners were sitting more around mid-pack and then making a late run.